How much was an impact case study worth in the UK Research Excellence Framework?
By Mark Reed and Simon Kerridge · 1 Feb 2017 · 7 min read
When the UK Government integrated impact into the Research Excellence Framework in 2014, it signalled how seriously it took the societal and economic impact of the research it funds. But how seriously?
The answer is something like £324,000 (£46,300 per year between 2015/16-2021/22) for the most significant and far-reaching impacts. Given that many of the people who were responsible for leading these impact case studies earn salaries less than this, for most people, that’s taking things pretty seriously.
We looked at Units of Assessment in REF2014 where a University had all its case studies graded as either 3* or 4* and found that:
- A 4* impact case study was worth £46,311 on average (range: £25,932-83,226) in 2016/17 (Table 1)
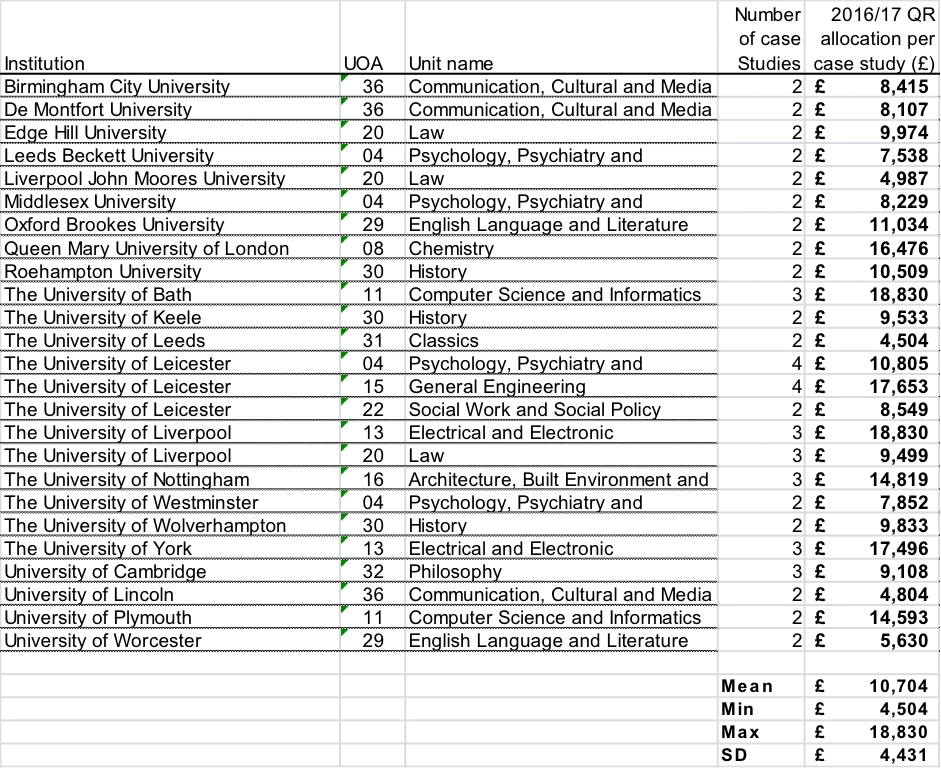
- A 3* impact case study was worth £10,704 on average (range: £4,504-18,830) in 2016/17 (Table 2)
The formula for calculating annual recurring payments for each of these case studies between now and the next REF may vary, but we can expect similar levels of funding per case study per year between now and 2021.
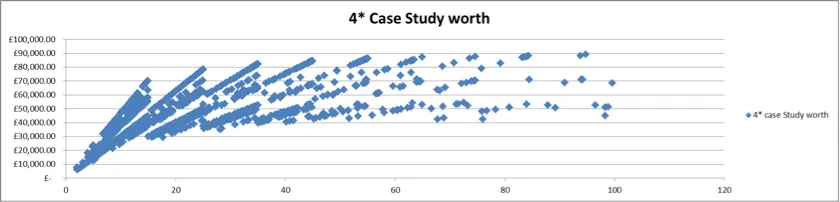
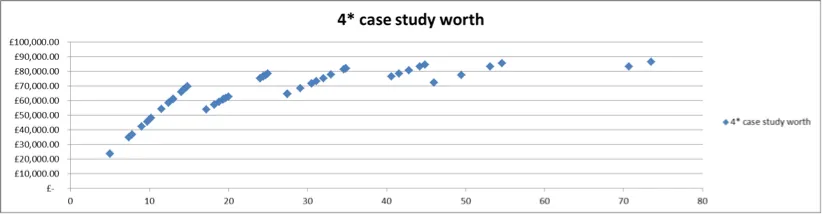
It is of course possible also possible to calculate the value of 3* and 4* case studies from any submission where QR funding is allocated (using the QR sterling value, the number of case studies and the quality profile). Using the method described below, we can determine the worth of a 4* case study for any given submission – giving us the full range for English HEIs of £6,005-£90,490. This is per year for 7 years until the REF2021-informed funding kicks in. Note that these values include, where applicable, the London weighting (although the highest is actually from outside London). You can see this spread in the scatter graph below (showing funded English UOAs with <100 FTE staff):
In contrast, a 4* research output was typically worth between £5,000-25,000 (see below for our workings). In general case studies are worth far more than research outputs for all but the smallest submissions. Generally speaking, a case study was worth around 5 outputs at higher FTEs, with more variation at lower FTEs.
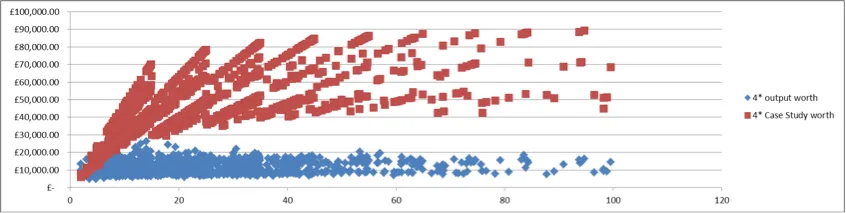
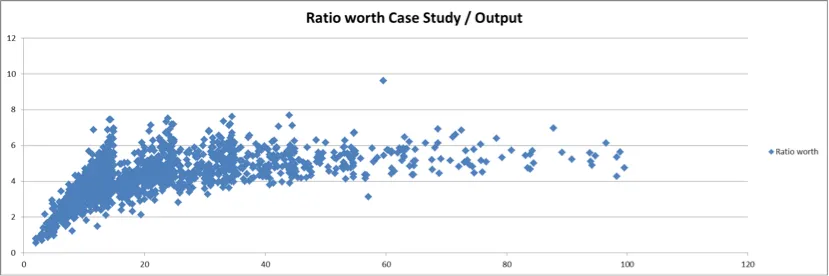
Table 1: Quality Rated (QR) funding allocated by HEFCE in 2016/17 per 4* impact case study, based on the case studies from Units of Assessment where 100% of the impact sub profile was graded at 4*
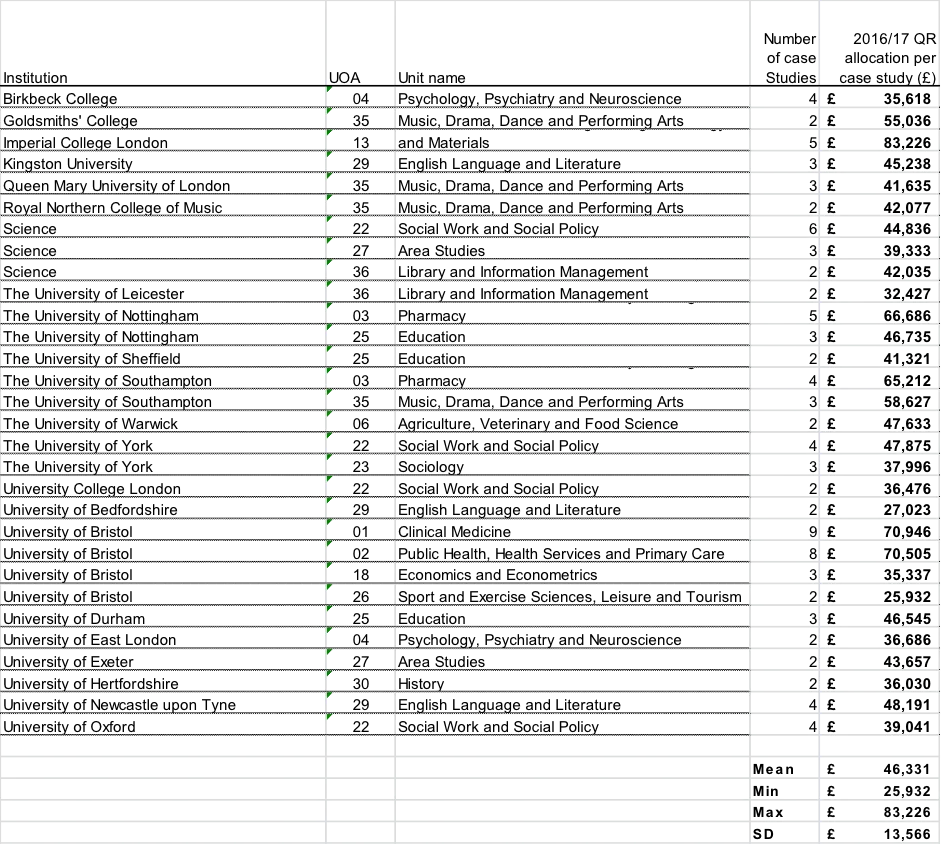
Table 2: Quality Rated (QR) funding allocated by HEFCE in 2016/17 per 3* impact case study, based on the case studies from Units of Assessment where 100% of the impact sub profile was graded at 3*
What does all this mean for UK researchers?
Whatever our motives for generating impact from research, our employers are partly motivated by the financial rewards now linked to impact, and indeed the associated league table positions based on “impact excellence”. The extent to which this translates in any meaningful way into incentives for researchers depends on the way each institution chooses to use that funding. Some Universities top-slice QR funds for central uses and allow some to trickle down to faculties and departments and the researchers who were responsible for the research that was submitted to REF. In some cases, decisions about spending this money are being taken centrally without any input from faculties or schools, let alone the researchers involved in generating the impacts. In Kent, the policy is to allocate the QR funding to the schools that ‘earned’ it, based on their staff FTE submitted to the various UOAs. However there is a ‘central charge’ levied on school allocations in order to determine their budget, so a top slice - but based on activity rather than allocation.
Some of us are pleased that at last, impact is being valued highly enough to be rewarded in this way. However there are also concerns about the power of these financial incentives to create game-playing tactics that will bring the academy into disrepute. We share both these feelings. Arguably, it is only because of the financial and reputational rewards associated with the REF that impact is now so widely (although far from universally) integrated into workload models and promotion criteria across the sector. These incentives are clearly motivating many researchers to engage with impact who had never fully considered the effect of their research before. However, it is these very incentives that are leading some researchers to chase impact for purely career-based motives, which has the potential to result in negative unintended consequences. As the rewards become greater, we must become ever more vigilant to these behaviors, and do all we can to build research cultures that value impact intrinsically, whether or not the benefits can be submitted to REF or are likely to score highly.
Methods
It is possible also possible to calculate the value of 3* and 4* case studies from any submission where QR funding is allocated using the QR sterling value, the number of case studies and the quality profile. These data are available (for English HEIs) on the HEFCE website. The full process for determining the value of a 4* case study for each UOA submission is the subject for another article; but as an example, if £50k funding is given for a UOA submission with 10FTE staff and a quality profile of 20% 4*, 20% 3* and 60% 2* then we can calculate the value of a 4* case study in that submission (had there been one). We know that only 4* and 3* attract funding and that 4* is worth 4x as much as 3*, we can say that the 20% 3* is equivalent to an additional 5% 4* (ie a profile of 25% 4*, 0% 3* and 60% 2* would attract the same funding). So this means that each percentage point of 4* is worth £50k/25 ie £2k. Remembering that for 10FTE staff 2 case studies would be required and that the case studies are worth 80% of the impact profile (the impact template being worth the remaining 20%), this means that each case study is worth 40% of the profile. Had the profile been 100% 4* then (as each % is worth £2k) the value would have been £200k. So a single 4* case study would be worth 40% of this, ie £80k.
There are of course a number of factors to consider, such as the subject banding, but the most crucial is the huge effect of the FTE cut off for needing an additional case study. For a submission of 14.99 FTE staff, 2 case studies would be needed, whereas 15.00 FTE staff (with the same quality profile) would get only a tiny amount of additional funding, but each of the 3 case studies would be worth (just over) 2/3rds of for the smaller submission. Similarly, adding another FTE to 16 would then increase the value of each of those 3 case studies by 1/15th.
This effect is perhaps most easily demonstrated in the first scatter graph above. Note that for clarity we have excluded the 48 UOA submissions with > 100 FTE; we have only included those 1,369 that also have English QR allocations for both Impact and Outputs. The discontinuity between case study number boundaries can be seen with the differing subject bandings. To see the discontinuity even more clearly, it is useful to look at a single UoA, for example Computer Science:
A similar calculation can be done for the worth of research outputs, although there are some wrinkles. Double weighting has to be accounted for, but this is fairly straight forward. The biggest issue if that we do not know the exact number of outputs submitted for all UOAs – if there were some confidential ones, there is no record of them. The REF database contains 190,962 outputs, but the headline reported number is 191,150; so there are 192 “missing” outputs – these will be the ones marked as being confidential. We do not know for sure which UOA submissions they are from, but for the purposes of this discussion we can live with a few errors in our calculations – at most it can have effected 192/1526 (13% of submissions), but only to a small extent; the overall scatter graph is, we believe, representative.
The worth of 4* outputs is much more spread (without the discontinuity of the fixed by FTE number of case studies that we see for impact). For example a 10 FTE submission could potentially have as few as 10 outputs (1 for each of ten staff with individual circumstances allowing for a reduction) or as many as 200 (4 for each of 50 staff on 0.2 FTE contacts) – of course neither of these extremes is particularly likely! In fact the 8 that match our criterion of 10 FTE have between 32 and 40 outputs. Looking slightly wider, 9 to 11 FTE inclusive these 108 UOA submissions have numbers of outputs ranging from 25 to 58 – clearly the number of outputs can vary quite widely. What all this means is that the scatter graph for value of a 4* output is much more widely spread:
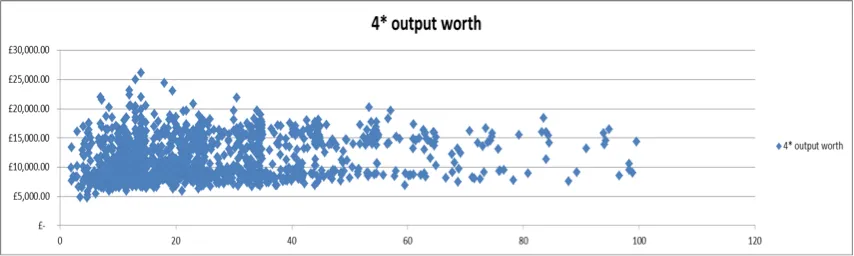
As expected the value of an output is broadly independent of FTE (unlike for impact case studies) with the variation being much smaller and due to fractional staff appointments (relatively rare in most UOAs) and individual staff circumstances – relatively evenly spread across UOAs.
Mark Reed holds the HEFCE N8 Chair of Socio-Technical Research at Newcastle University. He is a recognized international expert in impact research with >130 publications that have been cited over 9000 times. He has won awards for the impact of his work as a research Professor and Research Manager for an international charity.
Simon Kerridge is Director of Research Services at the University of Kent, vice chair of CASRAI and immediate past chair of ARMA. He was a panel secretary for the criteria setting phase of the REF and led the Kent REF2014 submission. He was also part of The Metric Tide team that advocated against metrics for impact assessment.
This article is from the Fast Track Impact magazine. Find out more and subscribe here.
See our links to all the identifiable 4* impact case studies from REF2014 here.
Read Sarah Buckmaster and Mark Reed’s blog linking 4* impact case studies to their original, pre-award pathways to impact here.
Stay up to date
Keep up with new resources, free training and recent thinking on research impact.