How to design a whole institution REF impact internal review: lessons from Northumbria University
By Alisha Peart & Lucy Jowett · 7 Dec 2017 · 6 min read
What would you do if you were asked to organise an internal review of REF impact case studies for your whole university? Run away? Hide? Look at what everyone else is doing?
As the two Impact Managers for Northumbria University given this task, running away and hiding was not an option. Learning from the experience of other institutions was also not an option, since it is difficult to find publically available information about internal processes for assessing impact.
In this blog, we want to take off the shroud of secrecy surrounding internal REF processes and share the approach we developed. Our hope is that others will share their experiences, and we can all learn more widely from best practice across the sector.
The challenge
We were tasked with designing an internal process for reviewing draft impact case studies for REF2021 that could help us identify progress towards submission in 2020, enabling us to shortlist those with greatest likelihood of scoring well, and helping us prioritise support for those with currently unrealised potential. Where are our strengths and weaknesses, where are resources needed and extra effort required? How can we manage risks to delivery and make the case for extra support and investment? We needed to develop a replicable rating mechanism that could be applied to every potential impact case study. The process must relate to all disciplines and the rating must be applied consistently across all four faculties, seventeen departments and fifteen units of assessment…and the results must be something that achieve institutional buy in.
Our approach
Our approach consists of five steps using a scoring matrix that grades case studies in relation to their relative impact (in terms of significance and reach) and likelihood of occurrence by 2020. The planned approach and associated guidance was shared with authors of potential case studies, together with a submission template and the promise of individual feedback following panel discussion.
Step 1 – Score by likelihood of occurrence by 2020
At this stage in the REF cycle we felt it was premature to make judgements on star ratings for impacts that were typically still in progress. To use an Olympic analogy, we wanted this to be a selection process for our elite (REF) athletes, identifying those that would probably form our Olympic REF squad in 2021 (green), those that could possibly be included with further support (amber) and those that need significant support or might be future stars for REF 2028 (red). Figure 1 shows our Red Amber Green (RAG) rating. To achieve consistency, a scoring matrix was developed for reviewers, supported by guidance on how to apply the scores based on the only information available at the time, the REF2014 panel guidance.

Figure 1. Red-Amber-Green (RAG) rating definition for filtering case studies by likelihood of occurrence in the 2017 internal review at Northumbria University (Alisha Peart, 2017)
Step 2 –Score by impact potential based on eligibility, reach, significance, strength of evidence and probability for improvement
The next step was to break case studies down into their component parts and their elements to assess the potential grade of the impacts deemed most likely to occur (see Figure 2 ‘Element a’). These included:
- the reach and significance of the impact;
- the quality of the supporting evidence collected to date; and
- the eligibility of the case study (including whether the underpinning research was conducted within the relevant time window, was conducted at this institution, at least 2 star in quality and clearly linked to the impact).
We also had to assess the probability of improvement (see Figure 2 ‘Element b’). There was no point judging our Olympic squad purely on today’s performance. How likely would it be, through extra work, support or just as things evolved over time, that they would be ready for the REF Olympics in 2020? So here we added questions relating to plans: to gather further evidence; to improve reach and significance; to publish research that would make the case study eligible; and to overcome other barriers to success.
To arrive at weightings for each element we reverted again to REF 2014 guidance to tease out the relative weightings applied by the panel.
Step 3 – Convert scores for likelihood and potential into an overall Red-Amber-Green (RAG) rating
Here we looked to a risk matrix, and used the axes for plotting underpinning research and impact to date (Figure 2 ‘impact/research score’ – element a) against probability for improvement (Figure 2: ‘Probability of occurrence within timeframe score’ – element b). Next, we took the scores for likelihood of occurrence (Element a) and the scores for impact potential (Element b) from each template’s assessment. By plotting these scores against the axes, we achieved a RAG rating for each case study showing highly likely, high potential case studies in green, and case studies with limited potential for impacts that were unlikely to happen by 2020 in red. Case studies with intermediate potential and likelihood of success achieved an amber rating, as did case studies that were either high potential but low likelihood, or high likelihood but low potential (Figure 2).
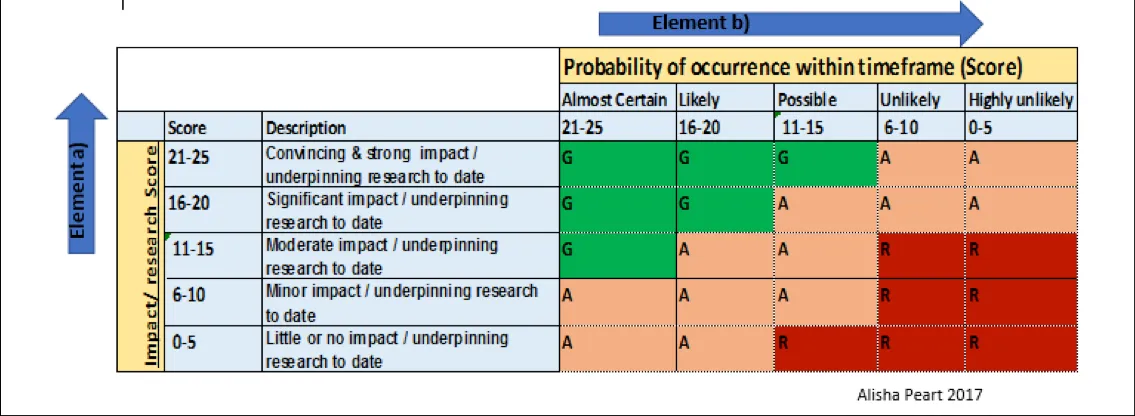
Figure 2. Matrix for combining scores for likelihood and potential into an overall RAG rating per case study
Step 4 – Panel discussion
To achieve full buy-in from the faculties we asked each Faculty Associate Pro Vice Chancellor for Research and Innovation to chair their faculty panel. The panels were made up of the unit of assessment leads, directors of research and innovation, and academic impact champions. In preparation for the panel, all members received every case study. They were asked to score no more than a set allocation each, but to have read every case study so they could contribute to the panel discussion.
Each case study was reviewed and scored by two panel members who sent us their completed scoring matrices, including written comments, and the RAG rating based on the scores. At the panel meetings, the reviewers fed back their RAG ratings and comments, each case study was discussed and agreement was reached on the final RAG allocation.
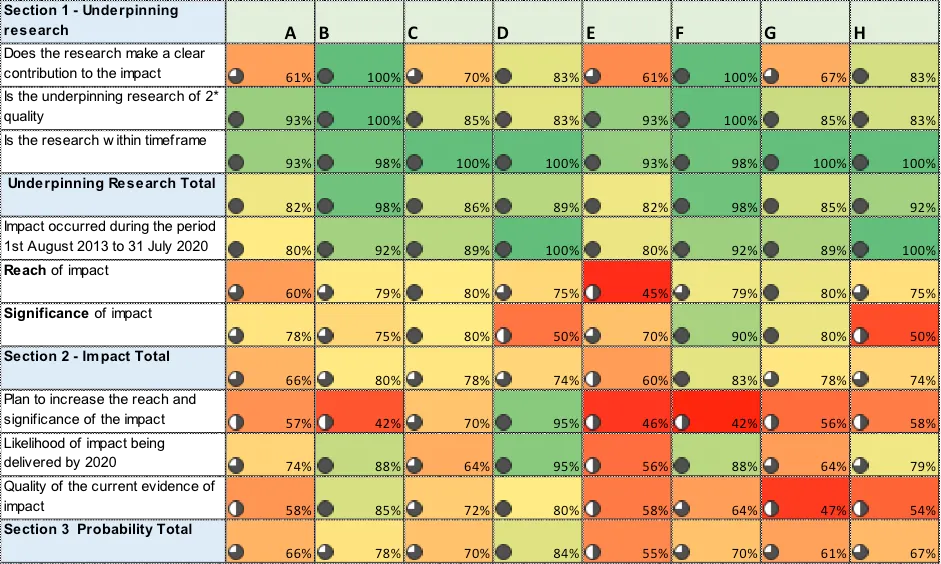
Step 5 – Create heat maps that can facilitate strategic planning and communicate the outcome
By developing a full scoring methodology in order to RAG rate our impact case studies, we have a very specific breakdown on how every case study is performing on the component elements. Moreover, by analysing the data at department, UoA and faculty level we were able to produce highly informative heat maps.
We were able to report back on how many potential case studies we had and where the strengths and weaknesses lay in every department. We could show if the underpinning research was an issue in one, or the evidence of impact in another, where our impact was strong, but the link between the research and impact was weak.
To communicate these results, we wrote tailored reports for each faculty and created an overall heat map for the whole institution showing hot spots and where resources, effort or time needs to be targeted. Based on this, we have developed university level and faculty level action plans which are being put into place. The reports have been welcomed and adopted by every faculty and the University’s REF Planning Group.
Figure 3. Example excerpt from the heat map generated by the review. This was available at institution, faculty or department level (Alisha Peart 2017)
We wanted the process to be supportive and engaging for individual case authors, and an opportunity for the unit of assessment leads and authors to establish a framework for progressing the case studies over the next few years. Every case had written feedback compiled from the panel review which unit leads have discussed with authors in one to one meetings.
Conclusion
We now have an indication of our potential Olympic team: a full list of every case study across the institution rated green, amber and red. Moreover, we have a body of rich data to analyse by unit of assessment, department or faculty and this data can tell us about performance on each of the component elements like research, impact or evidence. Feedback from case study authors and other staff involved at all leadership levels in REF has been positive across the University.
Now we want to hear from you. Have you done something similar, or are you taking a different approach? What seems to be working? By sharing experiences about this, we hope that others given this task might have somewhere useful to look for ideas, rather than running away and hiding!
#REF2021
Stay up to date
Keep up with new resources, free training and recent thinking on research impact.